Open account
Open accountLog In
Open account

Oct 30, 2025

Strategy

How to Trade Gold

In this lesson

How to Trade Gold

Gold trading is not an easy topic, as the yellow metal does not move the same way as other commodities or currency pairs on the Forex market. However, there are some well-known strategies that can help you succeed in gold trading.

Key drivers of gold prices

Key drivers of gold prices

Before applying strategies, it’s crucial to understand what really moves the gold market.

The main forces include:

  1. US dollar strength
    Gold is priced in USD, so when the dollar rises, gold usually falls — and vice versa.

  2. Real yields
    Falling real yields (bond yield minus inflation) increase gold’s appeal, while rising real yields make gold less attractive.

  3. Inflation and monetary policy
    High inflation and dovish central bank policies tend to support gold as a hedge. Hawkish rate hikes usually put pressure on gold.

  4. Central bank demand
    Purchases or sales of gold by central banks directly impact global demand and long-term price trends.

  5. Geopolitical instability and crises
    Wars, sanctions, terrorist attacks, or global political uncertainty drive investors toward gold as a safe-haven asset.

  6. Risk sentiment
    When fear takes over the market — through stock sell-offs, banking problems, or recessions — investors often move into gold.

  7. News
    Key events like CPI releases, NFP reports, and FOMC decisions can trigger sharp, short-term spikes in gold.

Understanding these drivers helps traders choose the right strategy: reacting to news, trading correlations, or following seasonal patterns.

Technical setups for trading gold

Before you choose a strategy, it helps to understand how traders use charts to read gold’s behavior. Technical setups are the foundation for timing entries and exits.

Support and resistance

Pay close attention to support and resistance levels. Use different timeframes to identify them according to your strategy. Big numbers like 3900 and 4000 can also be worth watching out for.

Indicators

Moving averages, RSI, and MACD can also be used to measure momentum or spot possible reversals. MACD lines crossing upward and oversold RSI can hint that buying pressure is ready to pick up steam.

Candlestick patterns

Patterns like a Hammer or an Inside Bar near a strong level can suggest a shift in sentiment. They can give you context for better-timed entries and exits.

Good traders rarely act on one clue alone.

They combine different data like technical signals, the dollar’s direction, bond yields, and central bank policy to get a fuller view before deciding to enter a trade.

Market participants overview

The buying and selling of gold is performed by a wide range of players. They each influence the market in their own way. Understanding who they are and what they do helps you see why gold moves the way it does.

Central banks

Central banks keep gold as part of their reserves. When they add to those reserves, it often supports prices. When they sell, prices can slip. Their actions usually affect long-term trends rather than short-term moves.

Hedgers

Producers, miners, and jewelers use hedging to protect their profits when gold prices change.

A mining company might sell futures contracts to lock in a price for gold it plans to produce later on. By doing that, it knows what it will earn even if prices fall. These kinds of trades can cause a bit of short-term selling, but the main goal is to keep profits steady, not to speculate on price moves.

Speculators and traders

Retail traders, hedge funds, and investment firms buy and sell gold to profit from price changes. Since they use a lot of capital and trade around big news or key economic data, their activity can affect volatility.

ETFs and institutions

ETFs hold real gold to back their shares. When investors buy into these funds, the ETF adds gold to its holdings, pushing demand higher. When investors sell, the fund releases some gold, which can put cause prices to go down. Institutional flows like this can make a big difference when market sentiment changes.

Gold trading instruments

There are several ways you can trade gold. Each instrument has its own set of characteristics, costs, and risks. Some traders even combine these methods. For example, using spot gold for short-term trades and ETFs or mining stocks for long-term exposure.

Spot Gold (XAUUSD)

This is the most direct way to trade gold. You buy or sell gold against the US dollar (XAUUSD) based on its current market price.

  • This offers tight spreads and high liquidity.

  • You can trade on margin.

  • No expiry date. You can hold positions as long as your margin allows.

  • Downside: Prices can move sharply during major market sessions or news events, and gaps can form from one trading session to the next.

Gold Futures

Gold futures let you agree on a price for gold now and settle the trade later. They’re traded on big exchanges like COMEX. Each contract covers a fixed amount of gold — usually 100 troy ounces — that’s meant to be delivered at a future date.

  • These offer deep liquidity and transparency.

  • The ability to take long or short positions.

  • Downside: They require more capital to trade and have expiration dates.

Gold ETFs

These funds track the price of gold and trade like a stock. They allow you to trade gold without owning the metal directly. They are an easy, straightforward solution for long-term investors. Examples include SPDR Gold Shares (GLD) or iShares Gold Trust (IAU).

  • They offer easy access through a regular stock account

  • No need to worry about storage or delivery.

  • Downside: Small management fees. You can’t use high leverage like in the spot market.

Gold Mining Stocks

You can also trade shares of gold-mining companies. Examples are Newmont (NEM) or Agnico Eagle Mines (AEM). These stocks often move in the same direction as gold, but not always at the same speed. Company earnings, debt, and production costs can all affect their prices, so they carry business risks that gold itself doesn’t have. Mining stocks can offer leverage to gold prices, because when gold rises, miners often rise even more.

News trading

Besides the usual statistics, gold is affected by political and economic factors, global disasters, terrorist attacks, and crises. This is because gold has tight connections with different equity and raw materials markets.

Gold can react unpredictably when news hits. After a major report or global event, prices can swing in both directions before settling down. That’s why it can be best to wait a bit before jumping in, to have a better idea of where the market wants to go after the noise fades.

For example, a sharp fall in the equity market results in the rise of gold’s price. This can help you place long positions.

Fundamental trading strategy: correlations

It’s no secret that gold has a strong negative correlation with the US dollar. That means gold and the US dollar move in opposite directions. A buy signal for gold usually means a sell signal for the USD, and vice versa. A good thing to know is that one of these signals can often form ahead of the other one, which presents a potential trading opportunity. Always check for confirmation.

Simple correlation trading setup

Fundamental trading strategy: correlations

Here's a simple checklist for trading gold with dollar correlations:

  1. Open the gold chart (XAUUSD), the US Dollar Index (DXY), and a dollar pair like USDJPY on the same timeframe, like H1.

  2. Mark support and resistance levels on both charts. Pay attention to breakouts or when gold and the dollar move in different directions.

  3. Check the candlestick formations to figure out where the price may be headed. For entries, if DXY or USDJPY breaks higher, that usually points to weakness in gold. If they break lower, it often signals strength in gold.

  4. Place your stop just beyond the most recent swing high or low, or behind a clear support or resistance level.

  5. Set a target with at least a 1:2 risk/reward. You can also take partial profit at the next important level.

  6. Cancel the trade if gold doesn’t react within two or three candles after the dollar move, or if real yields move differently.

Here is the strategy for trading gold using its correlation with the USD.

  1. Open the gold price chart and the USD cross-currency pair (for example, USDJPY) on your platform at the same time. Both of the charts need to be set to the same timeframe (for example, H1).

  2. Determine the key support and resistance levels on both of the charts and wait for breakouts. Follow the candlestick formations to find out where the price may be heading.

Sometimes, you see a resistance line on the USDJPY chart, but cannot discern any support on the gold chart. Note that the breakout of the resistance on the USDJPY chart can sometimes be followed by a sell signal on the gold chart. Therefore, if the USD is strong on USDJPY, that can be a signal to sell the gold.

Fundamental trading strategy: correlations

Fundamental trading strategy: correlations

The bearish candlestick forming on the H1 USDJPY chart above may hint that the dollar is losing strength, which could mean a move higher in gold. Still, it’s important to confirm this with other signals like trends, support and resistance levels, or momentum indicators, before entering a trade.

Gold often has a positive correlation with AUDUSD. Australia is one of the largest gold producers in the world. Gold prices can therefore affect the Australian dollar. When gold prices rise, export revenues improve, which can strengthen the AUD. When gold falls, the currency sometimes weakens. However, this relationship isn’t constant. The AUDUSD pair is also affected by global risk sentiment, interest rates, and Chinese demand for Australian exports. Reserve Bank of Australia policy decisions can influence this correlation too. When the RBA cuts interest rates, it can reduce demand for the AUD even if gold prices are stable or rising. In the image below, we can see that lower Australian interest rates coincided with weaker gold and a softer AUD. But no pattern is set in stone. It depends on global market conditions.

Fundamental trading strategy: correlations

Seasonal trading strategy

Seasonal trading strategy

The price of gold often follows a seasonal pattern. Gold can be stronger during certain times of the year and weaker during other times. Historically, it tends to go up in the first quarter of the year and sometimes again toward the end of the year, though it does not happen every year. Always remember that

past price patterns do not guarantee future results.

Other factors like inflation, interest rates, and geopolitics can affect seasonality too.

  • The first step is to buy gold in the months when gold’s price has historically tended to increase. This is often at the beginning of the year (in January and February).

  • Wait for confirmations from indicators like oscillators (MACD, RSI) and candlesticks to signal a potential reversal.

  • If gold is following its seasonal pattern of strength in January, it can be your opportunity to go long.

  • Take profits before the end of February if the trend starts to fade. Historically, March has been the worst month for trading gold, so if you choose to base your trade on past seasonal data, you can close your position before that period.

When to trade gold

The spot price for gold on most charts is usually set around 10:30 and 15:00 GMT, after daily auctions held by major players in the gold market. These auctions are organized by the London Bullion Market Association (LBMA). They establish benchmark prices that large banks and institutions use for trading and settlement.

Prices can swing sharply right after the new benchmarks are set, as the market adjusts. Many traders open or close their positions during this period because there is often more price movement.

During daylight saving time, the auctions take place an hour earlier at 09:30 and 14:00 GMT. Outside of these windows, gold trading remains active, but the London and New York session overlap (12:00–16:00 GMT) usually sees the strongest liquidity and most consistent price movement. That’s when both markets are open, and a large share of global gold transactions takes place.

Note: Gold is among the most volatile assets in the market. Always manage your risk carefully — size positions conservatively, place stops beyond clear levels, and be aware of overnight financing costs and sudden news-driven spikes. Protecting your capital should always come before chasing profit.

Risk management when trading gold

Gold prices can move sharply, so managing risk is just as important as spotting a good setup. News and gaps can have a big effect on your trade, and even a small position can lead to big swings when volatility spikes, especially if you’re using leverage. Protect your capital.

Use leverage carefully

Many brokers let you trade gold with very high leverage, but that doesn’t mean you should. In the EU and UK, retail traders are limited to 1:20 leverage on gold, but outside of those regulated markets, some offshore accounts allow 1:500 or more. That kind of exposure can wipe out your balance after a small price move. Use the lowest leverage that still gives you flexibility. You don't want a 1% move in gold to be a threat to your solvency.

Set stops with market volatility in mind

Gold’s daily range can be wide, so fixed-size stops don’t always make sense. Instead, many traders base their stop-losses on the Average True Range (ATR), which measures recent volatility.

Position sizing

Let’s say you have a $10 000 account and want to risk 1% per trade ($100).

If your stop-loss is $5 wide, you can trade 0.2 lots on XAUUSD (since each $1 move equals $10 per 0.1 lot). That way, a $5 loss per ounce equals your $100 risk limit.

Watch overnight financing costs

When you hold gold positions overnight, your broker applies a swap or rollover fee. These costs reflect the interest rate difference between gold (a non-yielding asset) and the funding currency, such as the USD. If you hold trades for days or weeks, these small charges can add up, especially for larger positions. Always check your broker’s swap rates and factor them into your plan.

Control emotion

Gold’s quick swings can tempt you to overtrade or move stops. Stick to your plan. Decide on reasonable entries, stops, and targets before opening positions, and never take risks by attempting to recover losses.

Trade mechanics and costs

Before you place a trade on gold, it helps to know how the numbers work behind the scenes.

Pip or tick value

Gold (XAUUSD) is quoted in dollars per ounce. On many platforms, the smallest move - one cent or $0.01 - is labeled a “pip” for convenience.

  • If 1 pip = $0.01, then a $1 move is 100 pips.

  • 1.00 lot = 100 oz → $1 move = $100.

  • 0.10 lot = 10 oz → $1 move = $10.

  • 0.01 lot = 1 oz → $1 move = $1.

Some brokers define a pip as $0.10 instead of $0.01. Always check your contract.

Margin requirements

Margin depends on leverage and the contract value.

  • At $4000 per ounce:

  • 1 lot is 100 oz, so the contract value is around $400 000.

  • With 1:20 leverage, your required margin is around $20 000.

Higher leverage means you can control a bigger trade with less money, but it's riskier. Every price move counts more, and a small move can swing your profits or losses by a lot.

Spread and commission

You pay the spread when you enter. For gold, spreads often sit around $0.10 to $0.30 per ounce, depending on the broker and market conditions. Some platforms also charge a commission for each trade, usually $6 to $10 for an opened and closed trade.

Overnight swaps

Hold a position past the rollover time and you’ll pay or receive a swap. Gold doesn’t pay interest, so long positions often incur a small daily cost, while shorts may sometimes receive a small credit. Rates vary by broker and by interest conditions, so check how your platform works.

Example at $4000

  • You buy 0.10 lot of gold. The price goes from $4000.00 to $4005.00.

  • Profit or loss before costs: $5 move × $10 per $1 move = $50.

  • Spread cost: If the spread is $0.20, then 10 oz × $0.20 = $2.

  • Overnight swap: If you hold it for one day, assume about a $1 to $3 cost for this size.

  • Net profit after costs: Around $45 to $47.

Every gold trade carries costs. Know your pip or tick definition, confirm your margin, account for the spread and any commissions, and factor in swaps if you plan to hold overnight. This helps you size positions sensibly and avoid surprises.

Common mistakes when trading gold

Jumping in right after news hits

Big reports like CPI, NFP, or Fed decisions can make gold prices very volatile. If you enter right away, there’s a good chance you’ll get shaken out before the real trend is revealed.

Ignoring bond yields

Don't only focus on the dollar. Bond yields adjusted for inflation are one of the main forces behind gold’s long-term moves. Trading against that current is a lot like trying to swim upstream.

Using too much leverage

TEXT WITH BACKGROUND Gold can move fast and hard.

There can also be big gaps after news breaks overnight. If your position is too big or you're using too much leverage, a sharp move can easily wipe out your account balance.

Relying on one correlation

Gold’s ties to the dollar or the aussie are useful, but they’re not ironclad. In a crisis, markets can break those relationships. Always check what price action is actually telling you before you trade.

Treating seasonality as a guarantee

Gold often rises early in the year, but that's not always the case. Take seasonal tendencies with a grain of salt. Wait for confirmation from charts or indicators before you trade.

Ignoring timing windows

A lot of volume flows in when the big gold auctions take place around 10:30 and 15:00 GMT. If you trade at quieter times, you may find yourself caught in a low-energy market without clear direction.

FAQs

What hours can I trade gold?

Gold (XAUUSD) trades almost around the clock. The most activity happens during the London and New York sessions, with extra liquidity around 10:30 and 15:00 GMT when auctions take place. Outside of these times, price movements can be slow and uneven.

What’s the minimum size to trade gold?

That depends on your broker. Many platforms let you start with a micro lot (0.01), which equals one ounce of gold. This smaller size is useful if you’re learning, as it keeps your risk manageable.

Why does gold react so strongly to news?

Gold is sensitive to data releases like CPI, NFP, and Fed rate decisions. These reports change expectations for inflation, yields, and the dollar, which all affect gold prices. The first minutes after news can be wild, so it’s usually safer to wait for direction before you enter.

Glossary

XAUUSD

The symbol for gold priced in US dollars. “XAU” is the code for one troy ounce of gold.

LBMA Fix

The London Bullion Market Association sets a reference price for gold twice a day. Big banks and institutions use it to price trades, and it often acts as an anchor for the market.
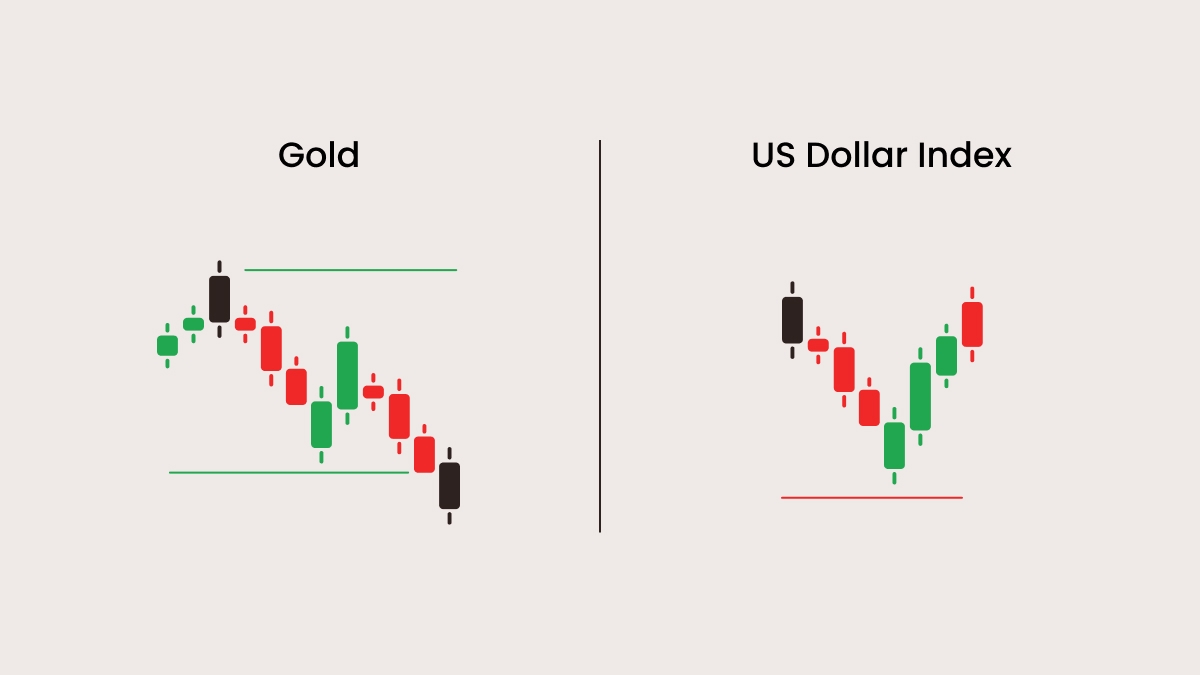
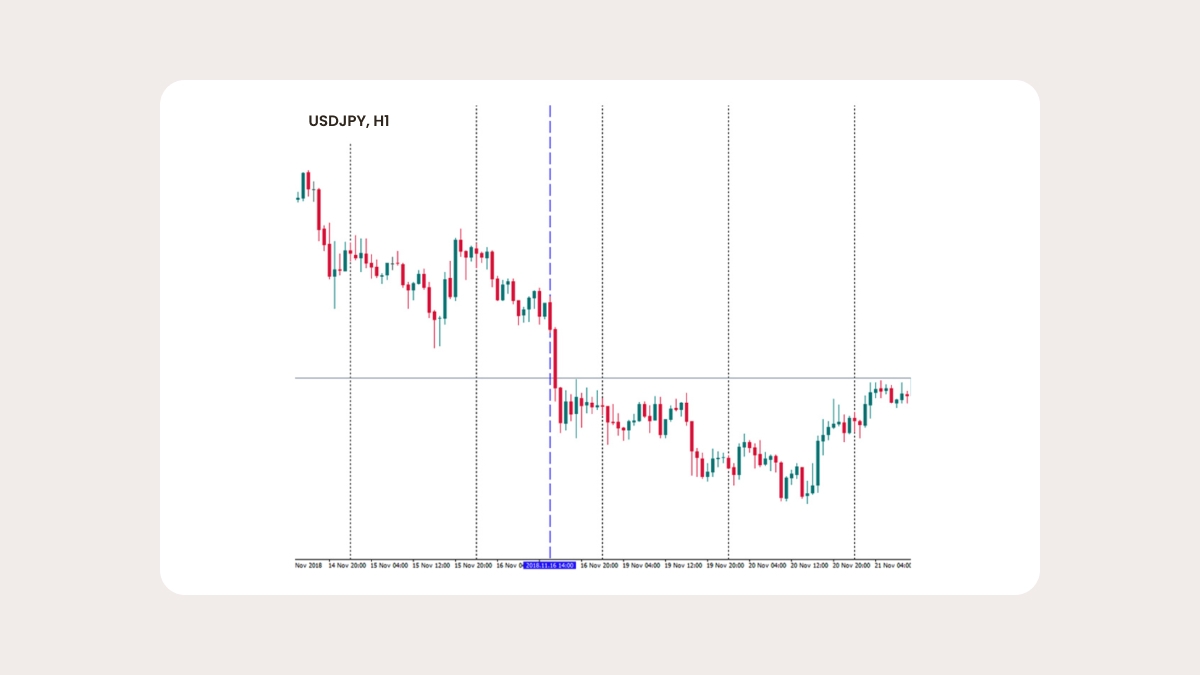
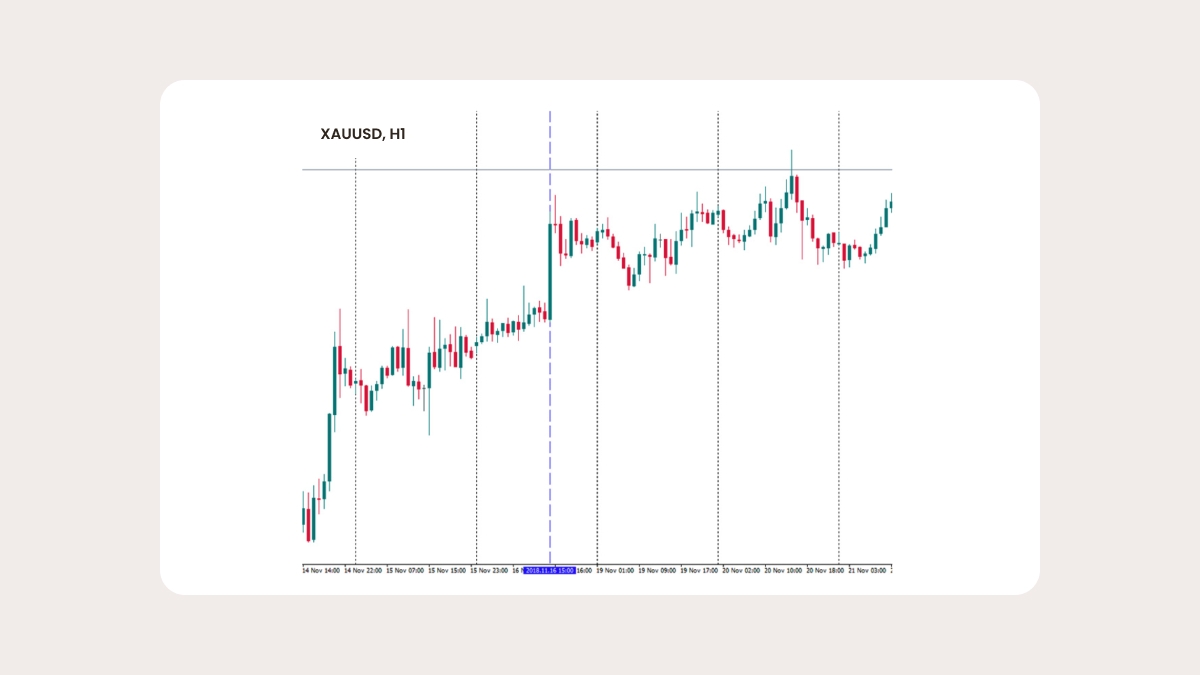
DXY

Short for the US Dollar Index. It measures the dollar against a basket of major currencies. Gold tends to move in the opposite direction, since it’s priced in USD.

Real yields

This is the return on government bonds after subtracting inflation. When real yields fall, gold usually gains appeal because it doesn’t pay interest. When they rise, gold often struggles.

Rollover

If you hold a gold position overnight, most brokers apply a small financing charge or credit. This “rollover” reflects the cost of carrying the trade past the market close.

Share with friends:

FBS at social media

iconhover iconiconhover iconiconhover iconiconhover icon

Contact us

iconhover iconiconhover iconiconhover iconiconhover icon
store iconstore icon
Get on the
Google Play
store iconstore icon
Get MT4 on the
App Store
store iconstore icon
Get MT5 on the
App Store

Trading

Company

About FBS

Our social impact

Legal documents

Company news

FC Leicester City

Help Center

Partnership programs

The website is operated by FBS Markets Inc.; Registration No. 000001317; FBS Markets Inc. is registered by the Financial Services Commission under the Securities Industry Act 2021, license number 000102/31. Office Address: The Bentley, #16 Cor A Street & Princess Margaret Drive, Belize City, Belize.

FBS Markets Inc. does not offer financial services to residents of certain jurisdictions, including, but not limited to: the USA, the EU, the UK, Israel, India, the Islamic Republic of Iran, Myanmar.

Payment transactions are managed by HDC Technologies Ltd.; Registration No. HE 370778; Legal address: Arch. Makariou III & Vyronos, P. Lordos Center, Block B, Office 203, Limassol, Cyprus. Additional address: Office 267, Irene Court, Corner Rigenas and 28th October street, Agia Triada, 3035, Limassol, Cyprus.

Contact number: +357 22 010970; additional number: +501 611 0594.

For cooperation, please contact us via [email protected].

Risk Warning: Before you start trading, you should completely understand the risks involved with the currency market and trading on margin, and you should be aware of your level of experience.

Any copying, reproduction, republication, as well as on the Internet resources of any materials from this website is possible only upon written permission.

The information on this website does not constitute investment advice, a recommendation, or a solicitation to engage in any investment activity.