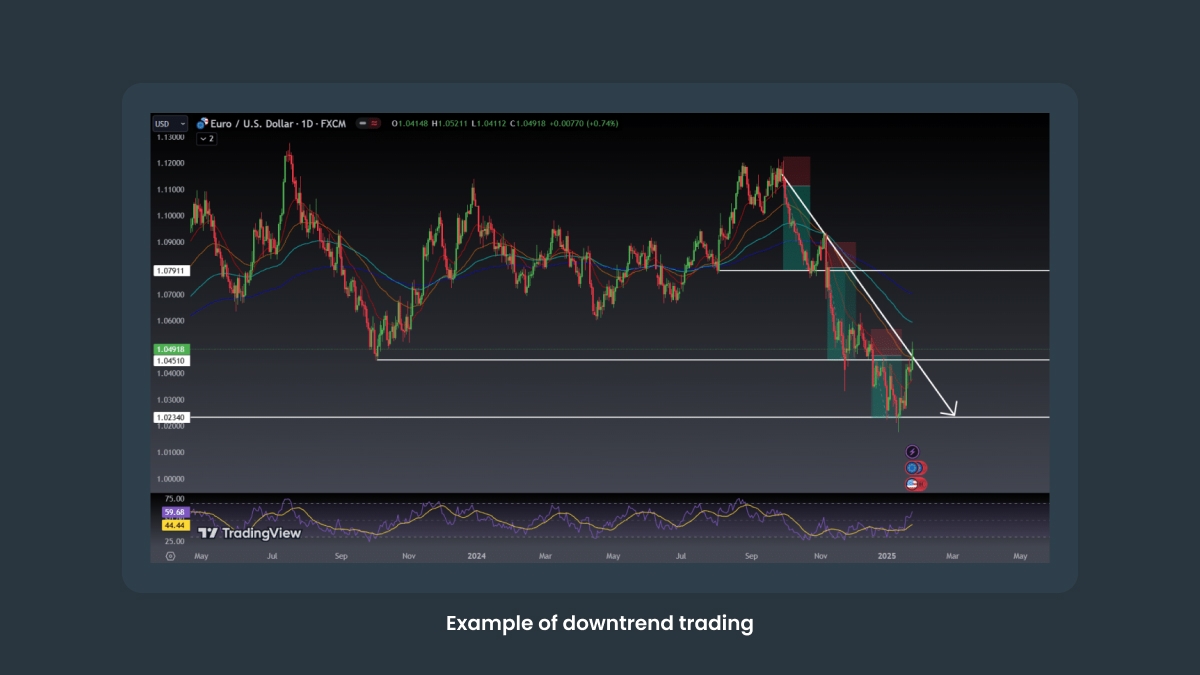
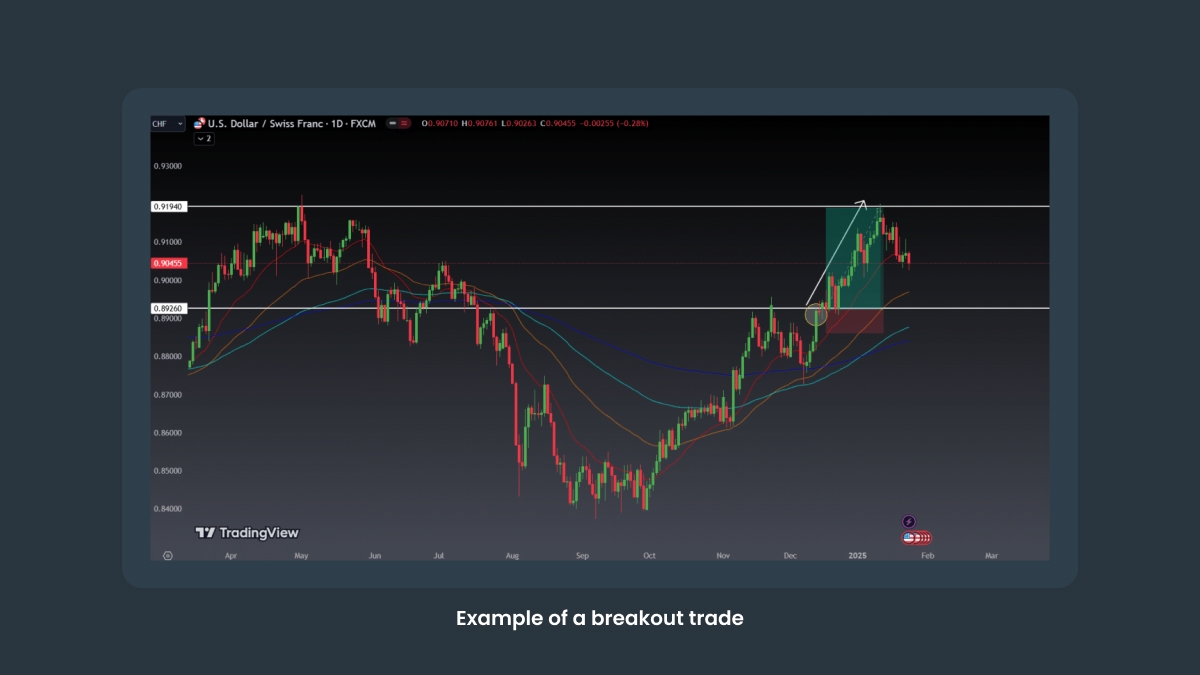
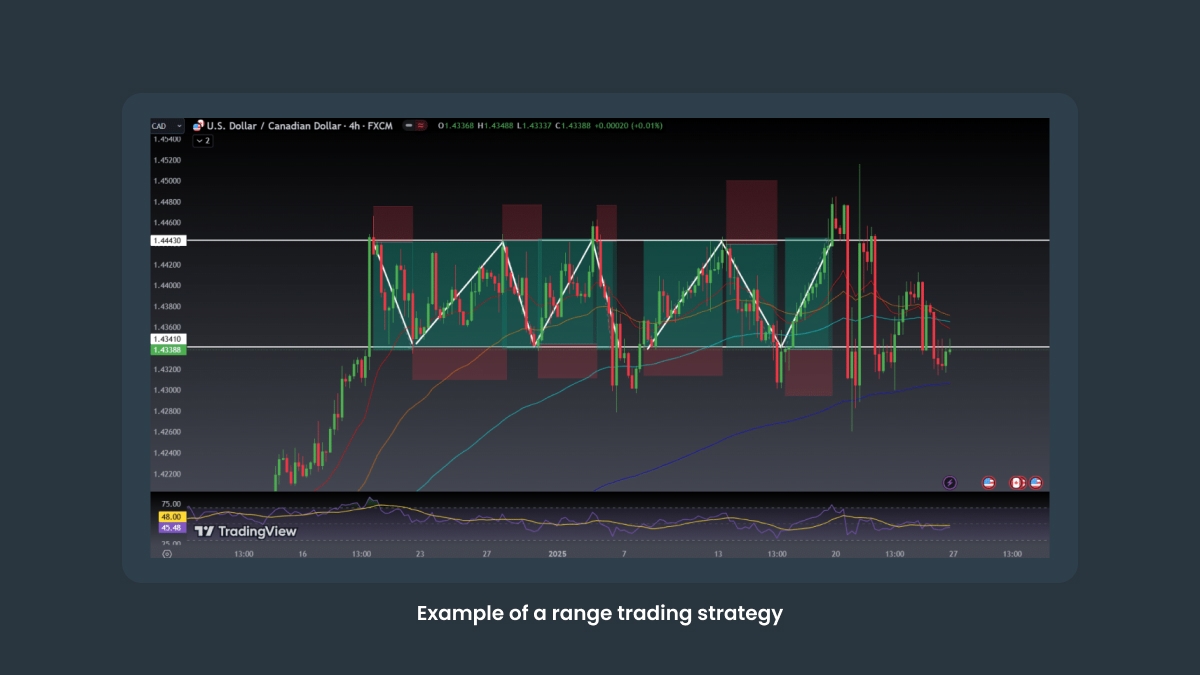
Set your rules, test them, and stick to them. Be able to sustain several losing trades and wait for the big winners without losing your cool. Trading on impulse or chasing moves will defeat the purpose of having a plan.
FAQs
1. What’s the best strategy?
There is no "best strategy." If you're new to trading, start slow. Follow trends or look for breakouts. Practicing on a demo account can help you get the hang of it in a safe environment. Build your strategy up from there. See what works for you and what doesn't, adjusting as you learn and gain experience. It's about what matches your style, capital, and schedule best.
2. How much money do I need to start?
You don’t need a big account to start trading. Use smart position sizes and manage your risk with stops and targets. A few hundred dollars is enough to start if you control your risk. Keep each trade small and avoid risking more than 1 or 2% of your balance.
3. Is trading Forex risky?
Yes. Markets are unpredictable. What you can do is mitigate that risk by being as prepared as possible. Use indicators and check for confirmation. Look at the bigger picture. Know which session times are more active. Set stop-losses and profit targets. Use the right tools and pairs for the situation. Leverage also multiplies risk.
4. How much time does trading take?
Trading will take as much time as you want it to. Some strategies, like scalping and day trading, call for constant monitoring and fast decision making. Others, like swing or position trading, require less time because you don’t have to watch charts constantly: you let the market do its thing over time and close when you reach your target.
Glossary
Indicators
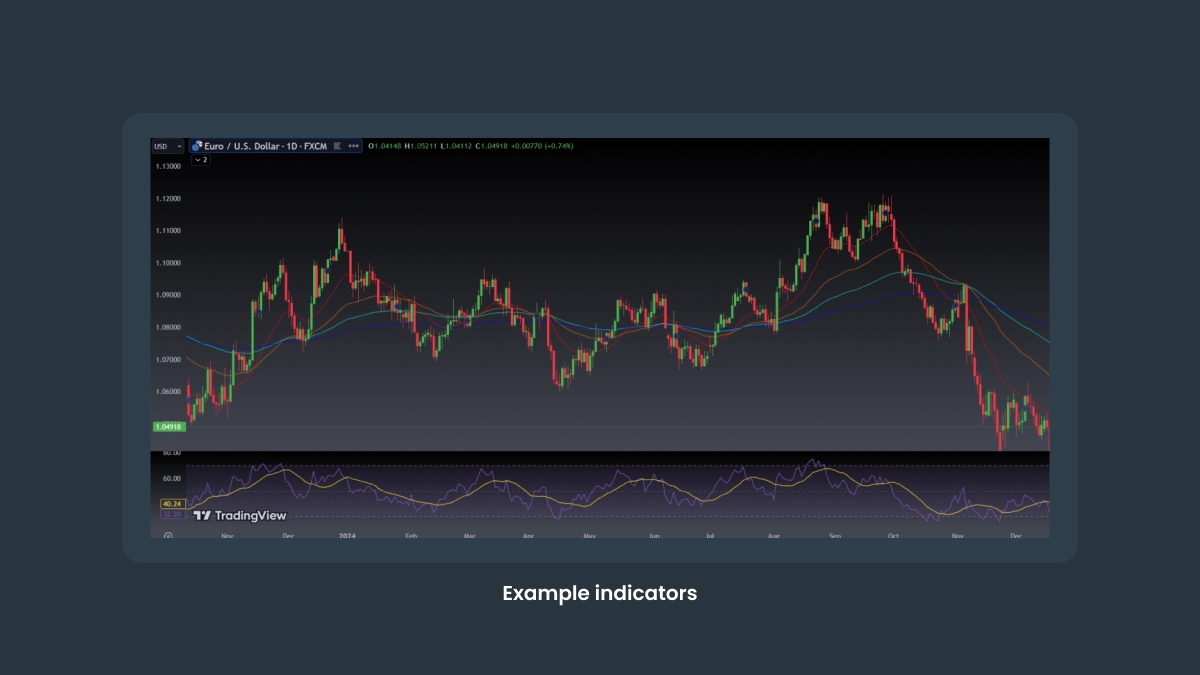
Indicators are tools that help you analyze price data on charts. They can show trends, momentum, volatility, or possible reversal points. Examples include the RSI and MACD.
Pip
Short for “percentage in point.” A pip is the smallest price move most currency pairs make. It’s usually the fourth decimal place. If EUR/USD goes from 1.0800 to 1.0805, that’s 5 pips.
Spread
The spread is the gap between the ask price and the bid price. It’s the cost of opening a trade. The smaller it is, the cheaper it is to enter and exit trades.
Leverage
Leverage lets you control more money than you deposit. A 1:50 leverage allows you to trade $50 000 with only $1000. It can boost profits when the trade goes the right way. But when price is volatile and swings the wrong way, even for a short while, your account can be totally wiped out if it doesn't have enough to cover the potential losses.
Drawdown
Drawdown measures how much your balance falls after losses. If your account drops from $10 000 to $9000, that's a 10% drawdown. Keeping these drops small helps you stay in the market.
Moving Average (MA)
A moving average takes the average price over a set number of candles, like 20 or 50, and smooths it out. It makes it easier to see the trend.
Relative Strength Index (RSI)
RSI is a line that tracks momentum on a scale from 0 to 100. When it goes above 70, the market is usually considered overbought. Below 30, it’s usually considered oversold.
MACD
MACD compares two moving averages to show changes in momentum and trend. The signal line and histogram highlight when momentum shifts.
Stochastic Oscillator
This tool compares the closing price to the recent range. A reading over 80 suggests the market may be overbought. Below 20 points to oversold conditions.
ADX (Average Directional Index)
ADX shows how strong a trend is. A value over 25 usually means the trend has strength, while lower numbers often signal a weak or sideways market.
Fibonacci Retracements
These highlights likely pullback levels during a trend. Common ones traders watch are 38.2%, 50%, and 61.8%. On a chart, these look like horizontal lines drawn between a high and a low.


