Fundamental Analysis
The S&P 500 is trading today around 6,480 points, after reaching its latest all-time high of 6,489.89 on August 14, 2025. This advance reflects a positive market sentiment, fueled by expectations of a Federal Reserve rate cut and moderate inflation data that strengthen investor confidence in the US500.
Despite the optimism, the latest producer price report showed a larger-than-expected increase, raising some caution about inflation persistence and its potential impact on monetary policy. However, the index remains close to its historical highs, showing resilience in a volatile environment.
The latest COT report for the S&P 500, dated August 8, shows that net speculative positions remained stable at -139,600 contracts, indicating a neutral sentiment among institutional investors. This suggests balance in market dynamics, with no strong bullish pressure or marked risk aversion, reinforcing the relative stability of the US500.
Looking ahead to August 15, S&P 500 traders will be watching for key economic data and Fed statements that could influence monetary policy expectations. The recent volatility highlights the importance of closely following fundamentals and market signals to anticipate the index’s future direction, especially with recent record highs acting as a psychological reference for investors.
Technical Analysis
US500 | H4
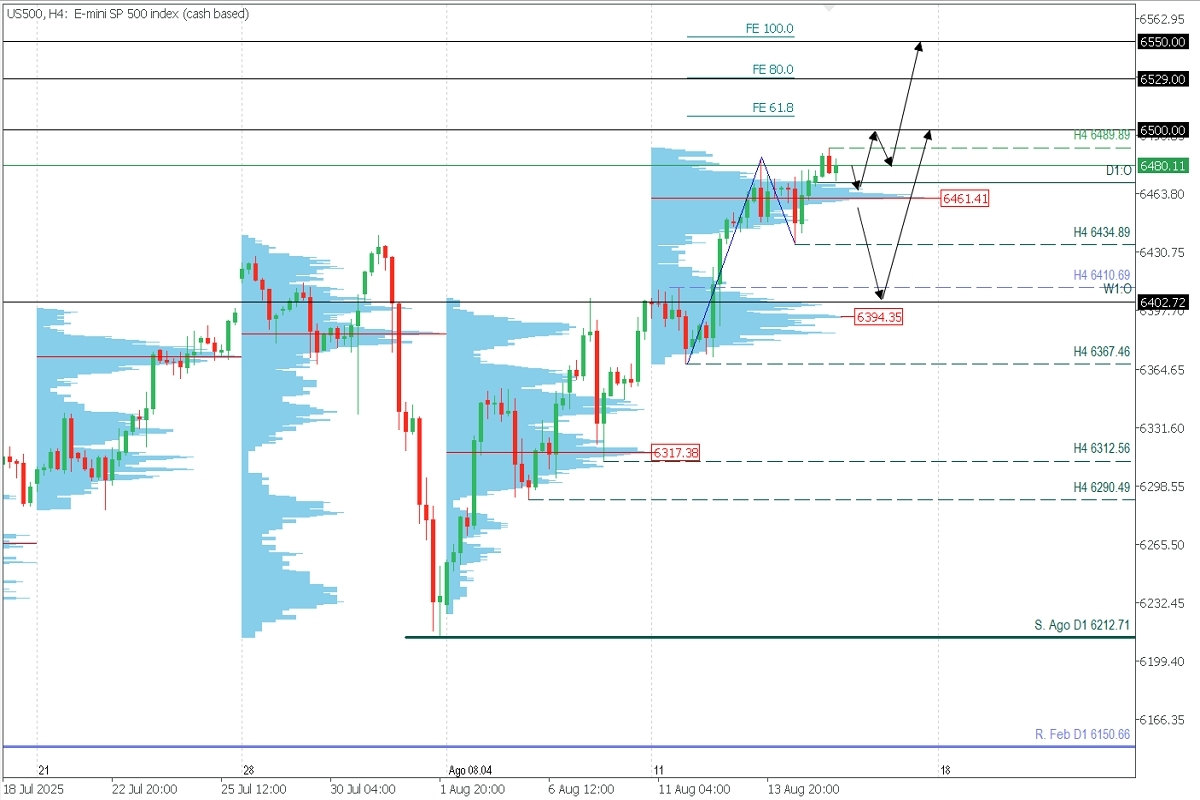
- Supply zones (Sells): 6530, 6550
- Demand zones (Buys): 6461.41 and 6394
The index has set several all-time highs (ATH) throughout the week, the latest at 6489.89 during today’s Asian session close. This week, price action left a volume concentration around 6461.41, a demand zone expected to act as volume support in the coming hours. Considering a possible moderate pullback, new buying opportunities are expected toward 6500, with extensions to 6529 and 6550.
This bullish scenario remains valid as long as the price holds above the weekly volume concentration. If broken, price could correct from 6461 down to 6435, 6410, and 6400, from where new long positions could be considered into next week.
- Exhaustion/Reversal Pattern (ERP): Before entering trades at the indicated key zones, always wait for the formation and confirmation of an ERP on M5, as explained here 👉https://t.me/spanishfbs/2258
- Uncovered POC: POC = Point of Control. It is the price level with the highest volume concentration. If the price drops after forming it, it acts as a resistance zone. Conversely, if the price rallied after forming it, it acts as a support zone, often located near lows.


