Gold Trying to Break Higher
Read the article on FBS website
Gold H4 Chart

Gold Daily Chart
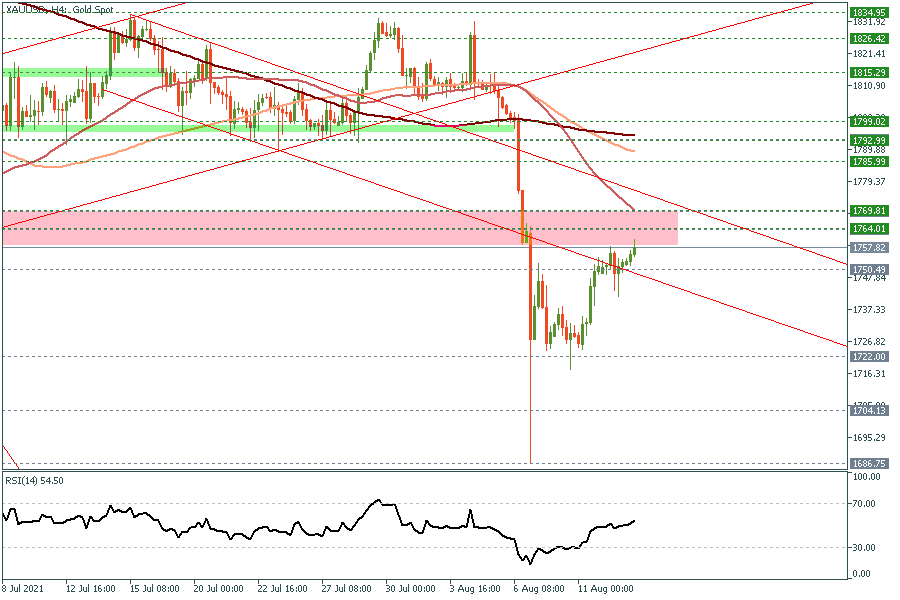
Gold managed to recover over 50% of its flash crash that occurred at the beginning of this week. After stabilizing above 1725, we issued a long signal at 1730 two days ago, and gold managed to rise all the way to 1759 until this report is released. In the meantime, it would be wise to move the stop to our entry to protect our position from any possible loss, while a weekly close above 1750 and preferably above 1760 would be another bullish sign not only on the short-term but on the medium-term as well.
| S3 | S2 | S1 | Pivot | R1 | R2 | R3 |
| 1717.85 | 1734.39 | 1743.65 | 1750.93 | 1760.19 | 1767.47 | 1784.01 |